Wood Moisture Content Chart: What's Safe, What's at Risk
By STOP THE ROT CO.

This wood moisture content chart is built directly from CMHC’s guidelines for on-site wood moisture measurement, the same reference we use on every inspection. Keep in mind a moisture-meter reading is most useful with context, where on the wood it was taken, what the wood’s normal range should be, not just as an isolated number.
The Moisture Content Scale
Moisture Content What It Generally Means
Under 15% Typical range for kiln-dried lumber at installation. No decay risk.
15% to 19% Still generally low-risk, a normal range for well-maintained exterior wood depending on season and exposure.
19% to 20% The threshold where decay risk begins to climb, per CMHC guidelines. Worth monitoring if sustained.
20% to 28% Elevated risk range. Decay becomes increasingly likely the longer wood stays in this range.
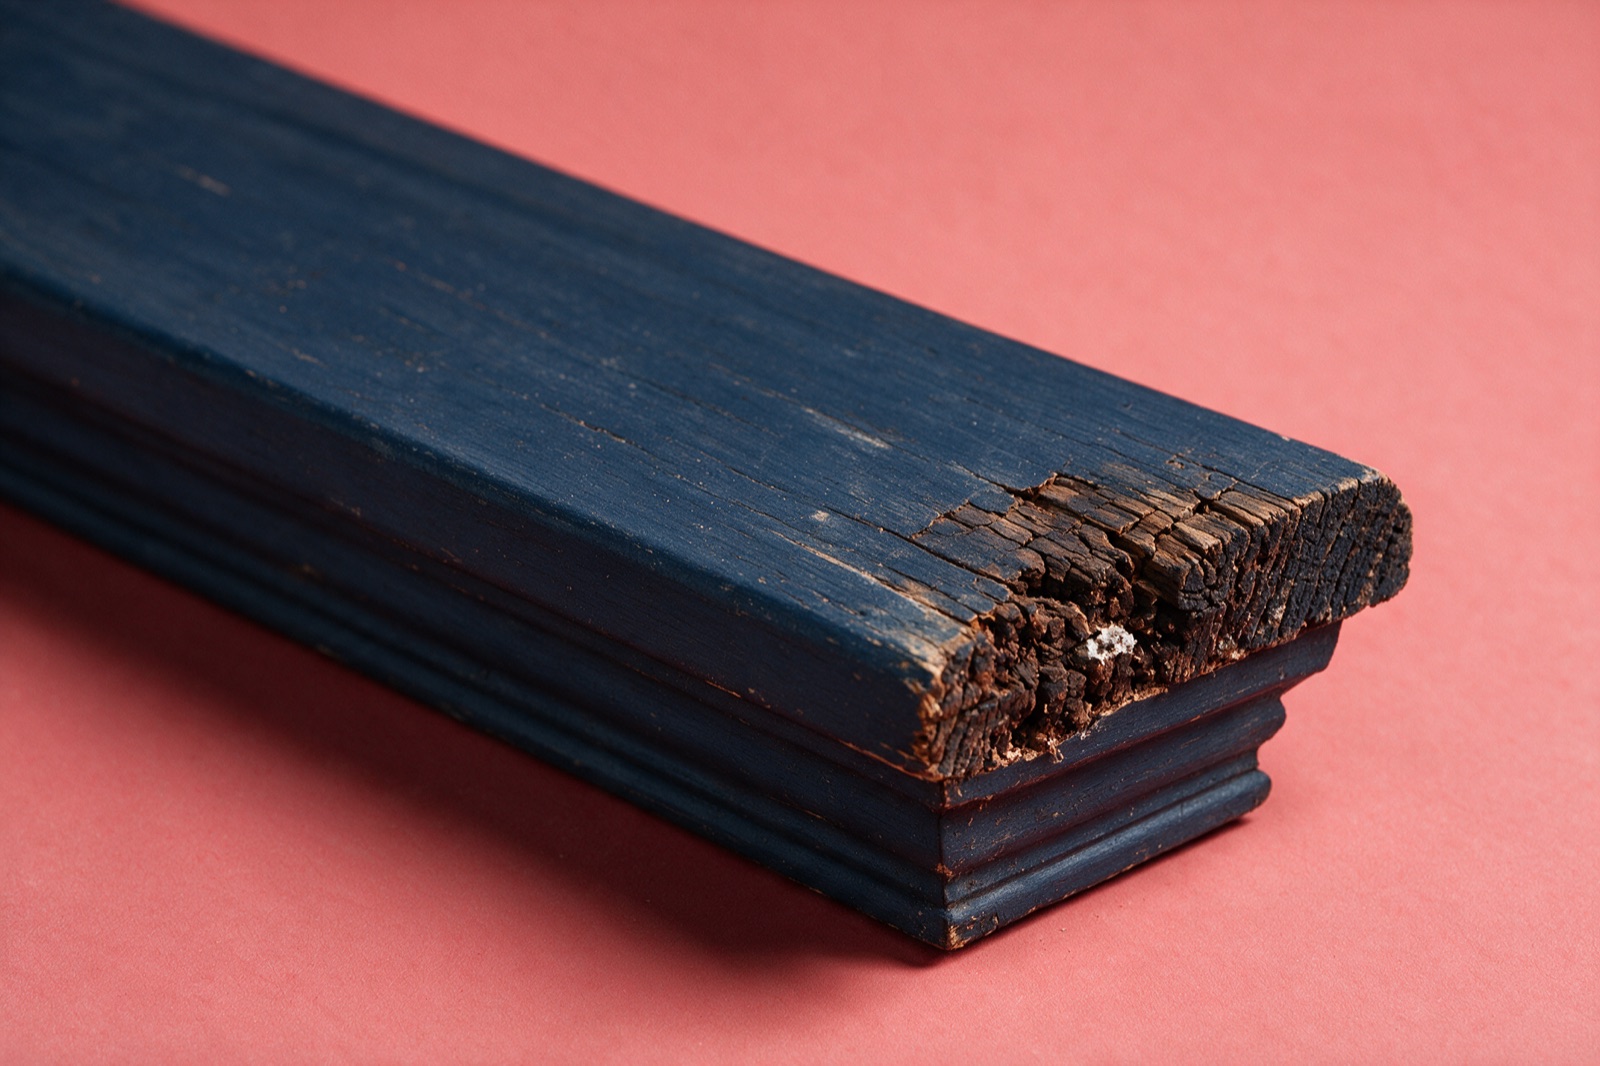
28% to 30%+ The fiber saturation point. Active decay is likely already underway, not just a future risk.
What “Moisture Content” Actually Measures
Moisture content is the weight of water in a piece of wood expressed as a percentage of the wood’s dry weight, not a measure of surface dampness. A moisture meter reads this by measuring electrical resistance (pin-type meters) or dielectric properties (pinless meters) within the wood, giving a number that reflects internal condition, not just how the surface feels or looks.
Why a Single Reading Isn’t the Whole Picture
Moisture content varies meaningfully across a single piece of wood, and across a single component. A post base commonly reads higher than the post top. A sill’s outer edge commonly reads higher than its center. A reading taken at one point tells you about that point, which is why a proper assessment tests multiple locations on each element rather than relying on a single number to represent the whole piece.
Typical Moisture Content by Context
Freshly kiln-dried lumber generally leaves the mill in the 12 to 19 percent range, depending on grade and intended use.
Wood in equilibrium with its environment settles to a moisture content that reflects the humidity and temperature around it, which shifts seasonally. Exterior wood in Vancouver during the wet season, October through April per Environment and Climate Change Canada’s climate normals, can reasonably run higher than the same wood would during the drier summer months, even when it’s healthy and functioning normally.
This is why an elevated reading isn’t automatically alarming on its own, context matters. A sill reading 22 percent in the middle of a wet Vancouver February is a different situation than the same reading in dry August, and a documented, professional assessment accounts for that context rather than treating every number the same regardless of when and where it was taken.
Why This Matters for Any Reading You See
A moisture-meter number only means something once it’s interpreted against the right context, which location, what season, what’s typical for that specific element. This is exactly why every reading we take gets documented in a written report with that context included, not just handed over as an isolated percentage.
Want an actual documented reading for your home, not just a chart?
A moisture-meter reading against this chart is exactly what we document on every job, see How We Fix It for the full process.
Sources: Canada Mortgage and Housing Corporation (CMHC), Guidelines for On-Site Measurement of Moisture in Wood Building Materials; Environment and Climate Change Canada, Canadian Climate Normals.